ShadeMap
A new lens on heat and where shade is needed most
Mapping Shade with UCLA
Shade is one of the simplest—and most powerful—tools we have to keep people safe in a hotter Los Angeles. But until now, it’s been hard to answer a basic question: Where is the shade?
Thanks to new research led by Dr. Kelly Turner at the UCLA Luskin Center for Innovation, in partnership with American Forests, shade is finally visible—and mappable—across hundreds of cities, including LA.
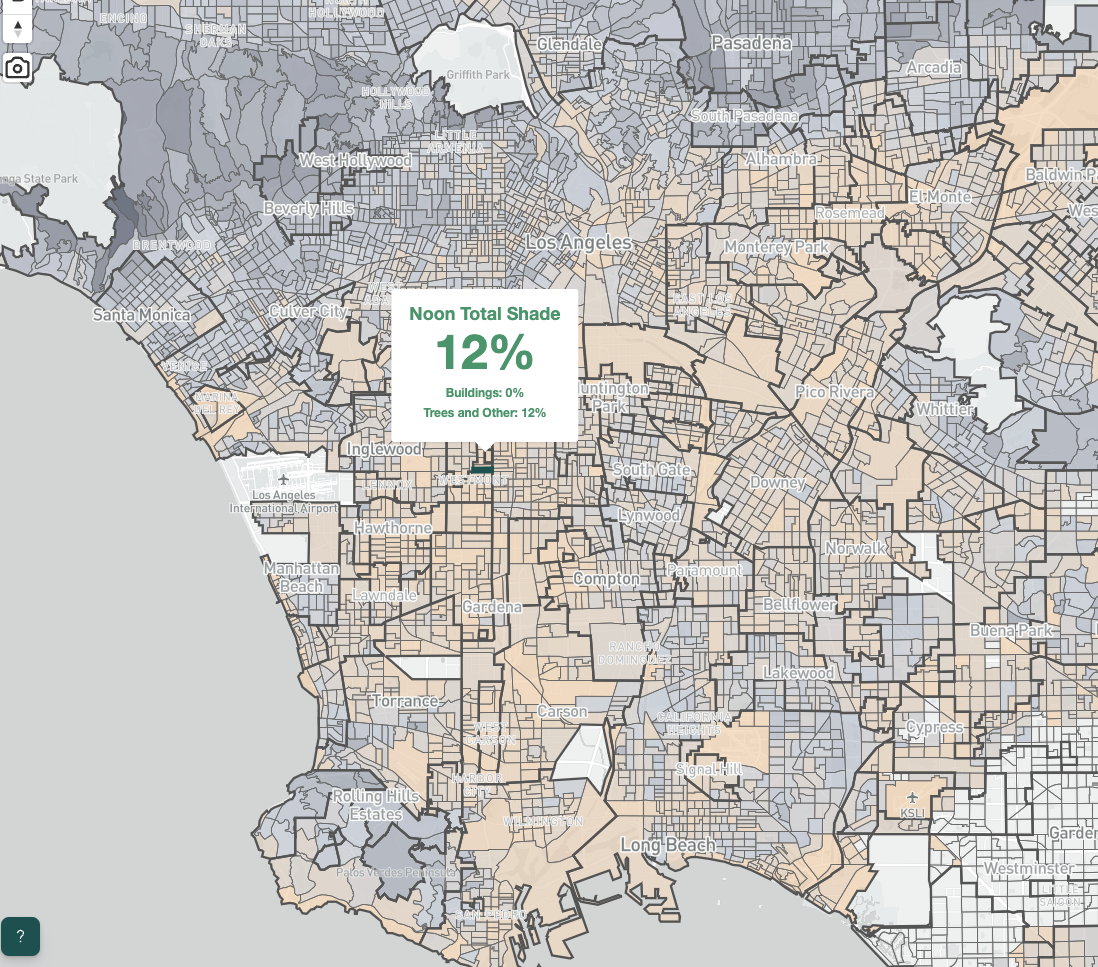
Explore the Shade Map
UCLA’s high-resolution data is integrated into American Forests’ Tree Equity Score National Explorer.
-
01
See how much shade is available
At three times of day (noon, 3pm and 6pm) in every Census block group
-
02
Understand what’s casting the shade
Trees, buildings, or both
-
03
Layer in social and environmental data
Such as income, demographics, canopy cover, and heat exposure
-
04
Identify shade deserts
And prioritize areas where investment is most needed
Quick Facts
Average shade in LA
-
01
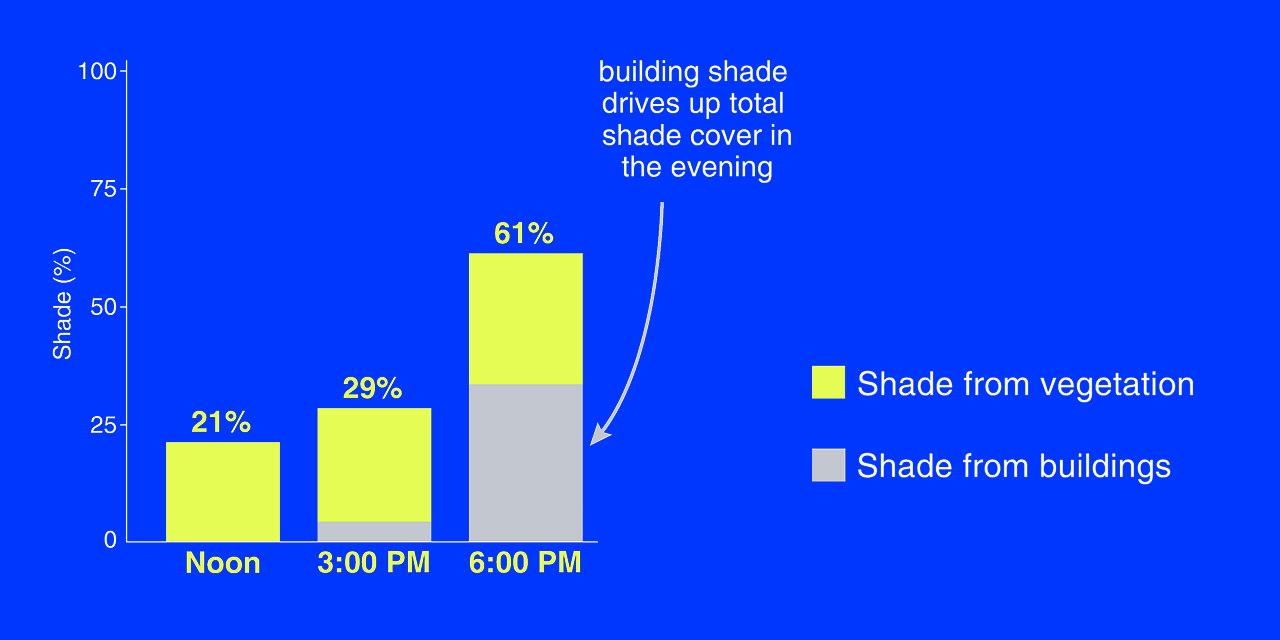
21% shade coverage at noon
This is 6% lower than the national average (27%).
-
02
Shade doubles by 6pm
In the evening, average shade more than doubles to 61% and is 2% higher than the national average (59%).
-
03
Vegetation provides 99% of shade at noon
But in comparison, buildings account for 55% of shade at 6 PM, indicating a shift in dominant shading sources over the course of the day.